Published Updated
Check whether this matches your current buying, selling, or location decision.
Scan the key points first, then decide whether to read the full analysis.
Is flipping houses still profitable in the Bay Area?
When I look at a Bay Area fixer, I do not stop at the difference between the purchase price and the remodeled comparable. I want to see the full...
Bay Area fixers can sell for more than they used to, but that does not mean the flipper keeps more profit. Higher purchase prices, labor, materials, financing, and delays have changed the math.
Bay Area fix-and-flip economics can show large gross dollars while producing a smaller net margin because acquisition, labor, materials, financing, holding, and selling costs have risen. When a project needs a higher finished price just to cover its cost floor, renovated sales can influence nearby price expectations even as fewer investors are willing to take the risk.
When I look at a Bay Area fixer, I do not stop at the difference between the purchase price and the remodeled comparable. I want to see the full ledger: construction, permits, schedule, financing, selling cost, contingency, and the price a real buyer will actually support.
You might be wondering
If any of these sound like you, this guide was written for you.
- Is flipping houses still profitable in the Bay Area?
- How much profit do Bay Area house flippers make?
- Why are Bay Area fixer homes so expensive?
- How do labor and material costs affect a house flip?
- Why do renovated homes push up Bay Area prices?
Visual Context
Make the decision easier to see
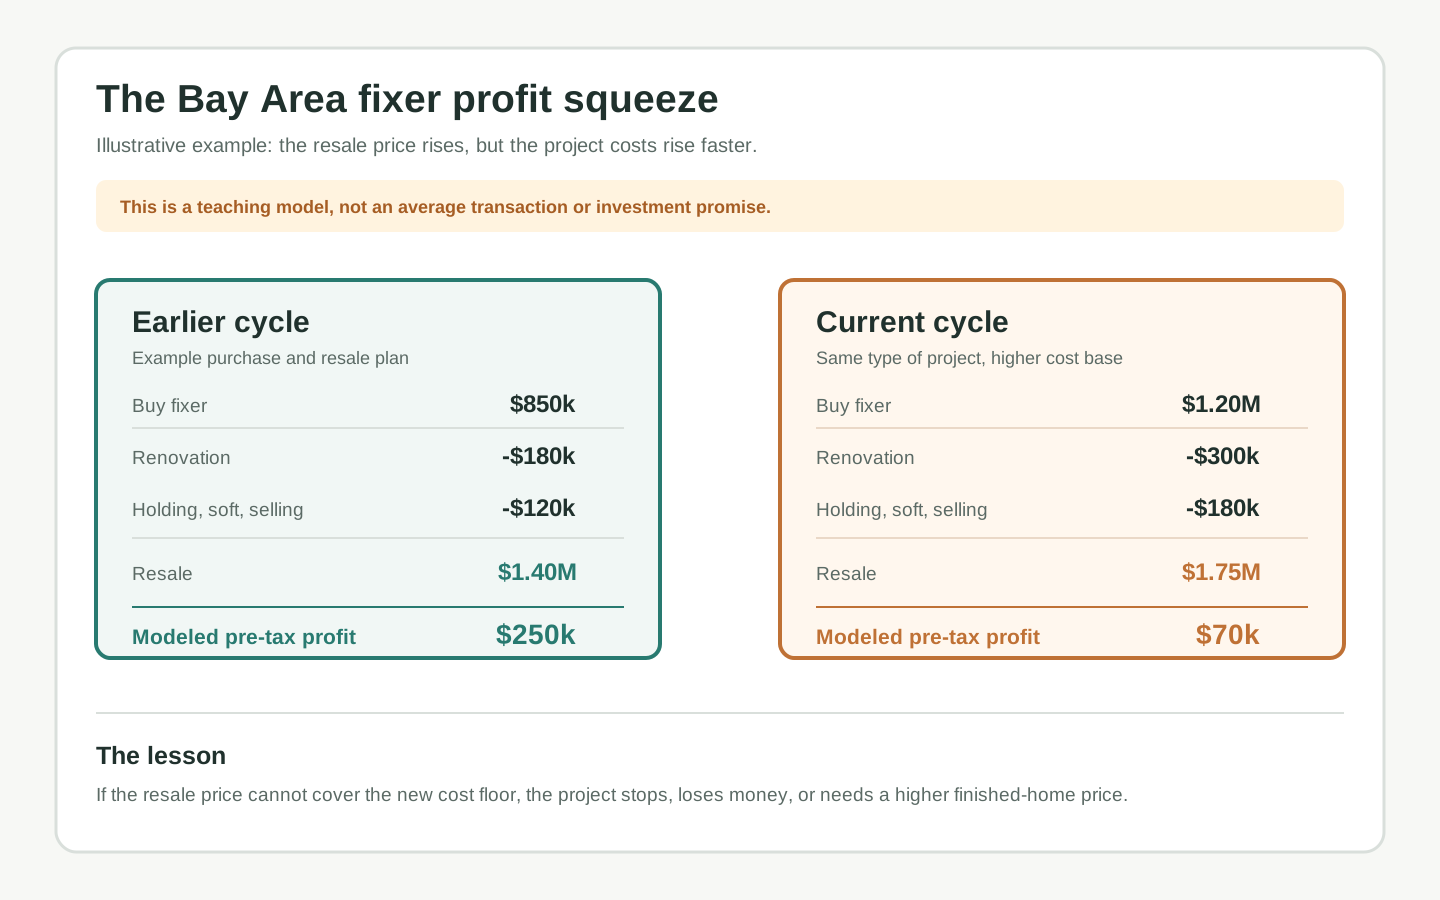
Read the ledger, not just the resale
The final result depends on acquisition, construction, holding, and selling costs, not only the renovated sale price.
What Bay Area buyers pay for
Buyers pay for a legal, clear, move-in-ready home, and that sale becomes a comparison point for the next property.

The home itself
Look at space, condition, maintenance, and resale before only reacting to photos.
Data source: ATTOM 2020 report, ATTOM 2024 report
Data source: ATTOM 2025 report, ATTOM Q1 2026 report
Data source: NAHB supply-chain cost brief, BLS construction wage-cost table
Read market news in layers
Market headlines only matter after they connect to your city, budget, and property type
-
Start here Headline
Check whether the news is statewide, Bay Area-wide, or specific to your city and price lane.
-
Supply
Low inventory does not mean every home is strong. Ask whether good homes are truly scarce.
-
Demand
Buyer speed depends on price, condition, location, and confidence.
-
Action
Bring the story back to whether you should wait, tour, offer, or sell.
-
By this point you are ahead of most
How is fix-and-flip profit actually calculated?
A fix-and-flip investor buys a property that needs work, renovates it, and sells it, often within a year. The simple headline is resale price minus purchase price. That is gross spread, not take-home profit.
A realistic flip ledger also includes demolition, design, permits, labor, materials, utilities, insurance, property taxes, loan interest, transaction costs, staging, real estate commissions, and the cost of surprises. In the Bay Area, a project can look profitable on the first two lines and fail on the full ledger.
What changed from a few years ago?
The Bay Area did not become cheap during the reset. It became more expensive to buy, finance, and renovate. ATTOM reported typical gross flip profits of about $274,000 in the San Jose metro and $171,000 in the San Francisco metro in 2020. In 2024, its published metro figures were about $283,000 and $218,000. Those headline spreads were still large, but they are not net profit because ATTOM’s gross figure does not subtract the renovation or carrying costs.
The broader 2025 market shows the compression more directly. ATTOM reported a typical U.S. flip gross profit of $65,981 and a 25.5% return on investment, down from $77,000 and 32.1% in 2024. Its Q1 2026 report showed gross profit around $66,000. That national trend should not be copied onto every Bay Area neighborhood, but it is a useful warning: higher sale prices do not automatically create better flip economics.
- Bay Area gross dollars can look stable or higher because the homes themselves are more expensive.
- The same gross dollar spread can represent a smaller percentage return on a much larger investment.
- Gross profit is not net profit. Renovation, financing, holding, and selling costs decide the difference.
- A neighborhood-level flip needs its own comparable sales and contractor bids.
Why did renovation budgets grow so much?
The cost pressure comes from more than one source. NAHB reported that building-material costs were 34% higher than in December 2020, with gypsum materials up 49%, steel mill products up 37%, and ready-mix concrete up 35% in its January 2025 supply-chain brief. BLS data also show construction and related occupation wage costs continuing to rise, with construction, extraction, farming, fishing, and forestry occupations up 3.8% over the year ending in March 2026.
Bay Area remodeling adds local friction. Older homes can hide electrical, plumbing, foundation, drainage, seismic, or code issues. A permit correction can extend the schedule. A skilled trade that is unavailable for three weeks can hold up every trade after it. Financing costs then keep running while the property is not producing income.
That is why a Bay Area fixer is not priced only by the number of new cabinets or square feet of flooring. The real budget includes uncertainty, schedule, insurance, and the opportunity cost of capital.

A simple Bay Area flip ledger
Consider the illustration in the graphic. In the earlier example, an investor buys at $850,000, spends $180,000 on renovation, carries $120,000 in soft, holding, and selling costs, and sells at $1.40 million. The modeled pre-tax profit is $250,000.
In the current example, the investor pays $1.20 million, spends $300,000 on renovation, carries $180,000 in other costs, and sells at $1.75 million. The resale price is $350,000 higher than in the earlier example, but the modeled pre-tax profit falls to $70,000.
The numbers are not a claim about the average Bay Area flip. They show the sensitivity of the business. If the resale price is $1.65 million instead of $1.75 million, the current example is already negative before tax. A small change in the finished value or construction timeline can erase the margin.
- Buy price: the scarce fixer may already be expensive because many buyers compete for land and location.
- Renovation: labor, materials, permits, and hidden conditions can move the budget quickly.
- Carry and selling: interest, taxes, insurance, utilities, commissions, staging, and closing costs continue until the sale closes.
- Resale: the finished home must earn its price from real buyers and comparable sales, not from the investor’s spreadsheet alone.
Why can a lower flip margin push finished prices higher?
A flipper is not the only force setting a Bay Area price. Buyer income, mortgage rates, land scarcity, school demand, job access, and the number of homes for sale matter more broadly. But renovation economics can affect the marginal supply of move-in-ready homes.
If a contractor, small developer, or flipper can no longer make the project work at the old resale price, three outcomes are possible. The owner leaves the home unimproved. The project is delayed or reduced. Or the finished home is listed at a higher price because the project needs a higher revenue line to justify the risk.
When buyers accept that higher price, the renovated sale becomes a comparable that can lift expectations for similar homes nearby. This is one reason fixer homes can indirectly push the market upward: the cost to create a move-in-ready alternative becomes part of the replacement-cost floor. But the effect is not automatic. If buyers reject the higher price, the flip loses money and the next investor becomes more cautious.
Why are fewer people willing to take on a fixer?
The answer is risk-adjusted return. A project that once offered a large buffer may now offer a narrow margin after a higher purchase price, more expensive work, a longer permit schedule, and expensive financing. Professional flippers can still succeed with reliable crews, direct labor relationships, disciplined acquisitions, or a strong niche. A casual investor has less room for error.
That can reduce the number of homes that are fully renovated and returned to the market. It can also increase the value of an existing permitted home in good condition because buyers are comparing it with the cost and delay of doing the work themselves.
The result is not that every fixer should sell for a premium. The result is that a fixer’s discount must be large enough to compensate for the real project risk. A house that looks cheap next to a remodeled comp may still be expensive if the difference cannot fund the work.
Adam's takeaway
Bay Area fix-and-flip math has changed from a simple appreciation story into a cost-and-execution story. Public data still show large gross spreads in San Jose and San Francisco, but gross spread is not the same as profit. The investor has to pay for the same things a homeowner pays for: labor, materials, permits, financing, time, and mistakes.
That explains why renovated homes can list and sell higher even when the flipper’s margin is thinner. The project needs a higher finished price just to make the work worth doing. Buyers should understand the mechanism without assuming every renovated home is overpriced or every fixer is a bargain.
The practical test is simple: start with a conservative finished value, subtract every real cost, add a contingency, and decide whether the remaining return pays for the risk. In today’s Bay Area, the best flip may be the one that never needs a perfect market to work.
Free segment read
Wondering what this market means for your specific move?
Tell me the city, home type, and whether you are buying or selling. I will reply with whether that exact segment is moving fast or sitting, and what that means for your timing. One email, no list to join.
Faster: text or call 510-813-3293, or WeChat Adam1Chen.
Related Local Guides
Helpful External Resources
Sources and Credits
- ATTOM 2020 Year-End Home Flipping ReportMetro-level gross flipping profits for San Jose and San Francisco in 2020.
- ATTOM 2021 Year-End Home Flipping ReportMetro-level gross flipping profits for San Jose and San Francisco in 2021.
- ATTOM 2024 Year-End Home Flipping ReportLatest report with published 2024 San Jose and San Francisco metro gross-profit figures.
- ATTOM 2025 Year-End Home Flipping ReportNational 2025 gross profit and ROI context.
- ATTOM Q1 2026 Home Flipping ReportLatest national quarterly signal available when this article was prepared.
- NAHB Material Supply Chains and CostsMaterial-price change since December 2020, including gypsum, steel, and ready-mix concrete.
- BLS Employment Cost Index, Q1 2026Construction, extraction, farming, fishing, and forestry wage-cost movement.
Image: Adam Chen original fixer flip profit-squeeze graphic